INTRA ORAL DENTAL SCANNER ACCURACY

In this application note ISO Standard defined artefacts of typical restorative dental geometries are measured using the TaiCaan XYRIS H Surface Profiler to produce Ultra High Resolution Digital Surfaces for the calibration of Intra Oral Scanners

  • The development of the Intra Oral Scanner (IOS) allow tooth, gum and existing prosthesis to be digitally reproduced by optical scanning (Digital Dentistry) without the use of traditional impression materials
  • Advantages – reduced acquisition time, reduced patient discomfort, faster manufacture of prosthesis
  • Disadvantages – inaccuracy in the measurement – technique and operator
  • The Problem – Understanding the magnitude and location of the measurement errors
  • The Solution – the use of a calibrated standard to assess the accuracy and reproducibility of measurements
  • TaiCaan Technologies supply Calibrated ISO Standards and digital data for assessing your IOS system measurement performance

The accurate and rapid transfer of the dental morphology record between patient and laboratory has been made possible by the use of  dental casting materials. In recent years there has been  an attempt to  reproduce, enhance and expand on the impression technique through development of the intra oral scanning (IOS).

Intra oral scanners offer the ability to rapidly measure complete tooth and gum surfaces without the use of dental impression materials. This offers advantages to the dental practice in simplifying and reducing clinical procedures times, while minimising patient discomfort.

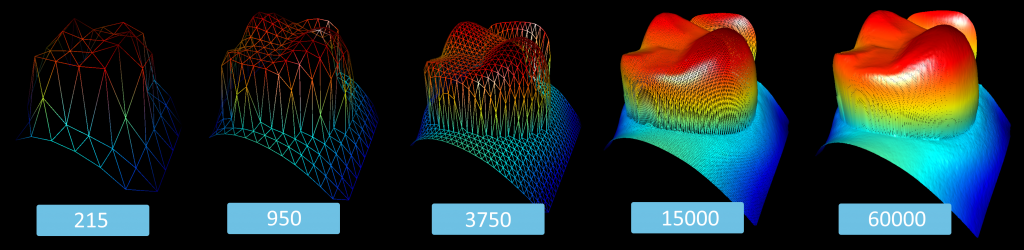
IOS operates by projecting light from a hand held ‘wand’ inserted into the patients mouth onto the surface of the gums and teeth. The reflected light is captured  as a digital point cloud map of the surface and can be reconstructed by software.

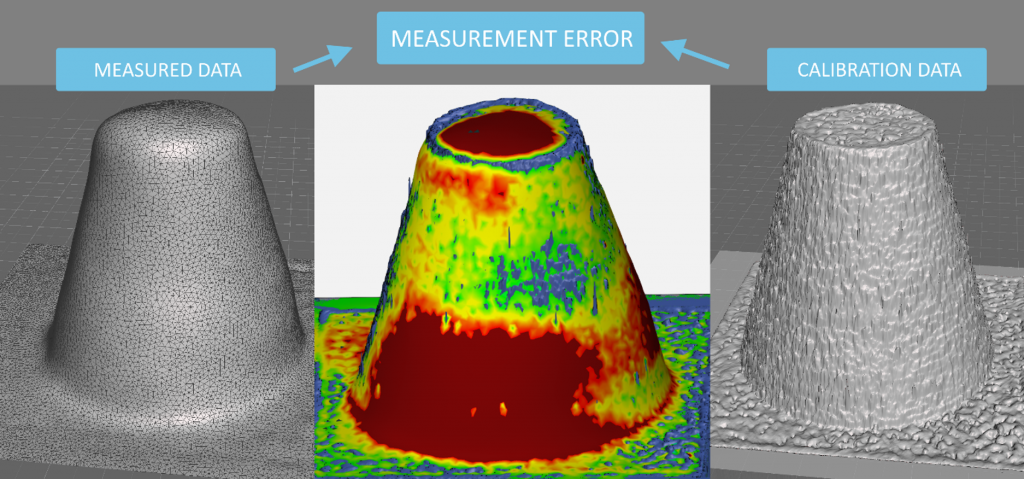
However, the complex nature of the technique and dental surface introduces uncertainty and inaccuracy in the measurement  as shown in Figure 1.

Figure 1 shows a calibrated measurement taken using a TaiCaan XYRIS 2020H (left). The calibrated data is then compared to a typical low precision measurement of the type generated by IOS. The comparison is shown (right) with the error highlighted by the colour scale

Three area of complexity in the measurement using IOS are;

  • ·        The surface reflectivity. This varies measurement performance. Factors such as actual surface material (e.g soft tissues, hard tissues, prosthesis), surface texture or the presence of saliva or blood all influence reflectivity.
  • ·        The surface generating software used with a IOS system is typically based on a a “best guess” average position from  repeat measurements. While this can improve the overall form measurement, detail of the surface is lost.
  • ·        Finally, the clinician operating the device introduces a complex source of variability in the measurement.

The combination of these errors can lead to poor data, especially at the difficult to measure margins between tooth and gum. The influence of the measurement detail and minor positional errors are shown in Figure 2 and Figure 3.

Figure 2 – The influence of the mesh detail on measurement error. A digital measurement of a dental impression mould with the colour scale indicating the height of the surface. The influence of number of measurement points in the data, increasing from left (215 measurement points) to right (60,000 measurement points). The form of the tooth is apparent with relatively few measurement points, but a much more complete measurement in required to capture detail of the margin. Note the reference TaiCaan measurement as shown in Fig 1, is typically 1 Million data points.

TaiCaan Technologies specialise in 3-D optical profiling solutions and over the last decade have worked with leading dental research organisations to provide an array of instrumentation, tools and techniques for advanced research into dental wear.

Dental Metrology Standard.

Using advanced manufacturing and measurement techniques we offer a series of calibrated artefacts designed to replicate the complex geometry of restorative dentistry. TaiCaan’s advanced series of XYRIS 2020 Surface Profilers are used to generate traceable calibration of these standards with submicron scale accuracy. Examples geometry of crown inlay and crown bridge preparations are shown in Figure 3, manufactured from laser fused medical grade stainless steel.

Figure 3 – The influence of positional error and limited detail on on measurement error. The measured points (green dots) and interpolation between measurement points (left image – green dotted line) cause volumetric errors indicated in the right image (black regions) that are maximum where the surface angle changes rapidly – such as the margins between tooth and gum.
Figure 4 – Calibrated restorative dentistry standards (ISO12836) with ultra high resolution 3D data. An inlay cavity (left) and crown bridge (middle) and calibration data sheet (right). Measurements are created with a TaiCaan XYris 2020 H surface profiler and the supplied data models comprise over 2 million data points with XYZ positional accuracy of 100 nm (0.1 um) for each point in the measurement.

The standards provide a reference for IOS measurements that allow measurement error to be quantified and inform the user of the locations of error. By comparison of the IOS digital model obtained to the supplied calibrated model, the location and magnitude of measurement errors can be identified as shown in Figure 5

This measurement of a calibrated standard allows the measurement error to be understood and defined – this offers vital feedback for laboratory technicians preparing prosthesis, and to the clinician on improving their technique.

Figure 5 –Measurement model (left) compared with the calibrated model (right) indicates regions of measurement error (middle). Green regions indicate the measurement is in tolerance with the calibration while red shows the measurement is larger and blue indicates the measurement is smaller than the calibrated model. Note the loss of all texture information and the smoothing at the vertices (edges).